Building a QFH antenna for weather satellites
#Make#RadioDid you know, that you can set up an antenna in your backyard and receive live satellite footage of the Earth? And I am not talking about satellite television. This is awesome!
The National Oceanic and Atmospheric Administration (NOAA) of the United States owns or operates multiple satellites for various applications. Some of these satellites transmit data to Earth that can be received by ordinary people without any highly specialized equipment. Of these, the easiest to receive are the three Polar-orbiting Operational Environmental Satellites - short POES - NOAA-15, NOAA-18 and NOAA-19. They each complete an orbit approximately every 102 minutes and transmit, among other things, low-resolution image signals, which can be easily received.
Understanding the signal
The three satellites from the NOAA POES constellation use the Automatic Picture Transmission system (APT), which includes two image channels, a synchronization signal and telemetry data. Notably the system does not send full images, instead it transmits data line by line. These lines have a fixed width of 2080 pixels with 909 pixels for each image channel at 4 kilometers per pixel. In short, that means the longer you receive the signal from the satellite that passes over you, the more vertical lines the resulting image will have. If you could follow the satellite, you would receive a continuous image of our Earth like the skin of a peeled apple. Unfortunately, the satellites’ velocity of around 7.5 km/s poses a grave obstacle to actually following them on the ground.
The signal itself is right-hand circularly polarized, because in contrast to linear polarization you don’t have to worry about the relative orientation of the sender and transmitter - getting directions in space is still a problem and the signal may rotate due to the Faraday effect. Furthermore with a circularly polarized antenna, there is no need to worry about reflections as left-hand polarized signals become right-hand polarized when reflected and vice versa.
Calculation and assembly of the antenna
Although a right-hand circularly polarized antenna is the best choice for receiving the NOAA APT signal, building one is not so easy. There is a nice post on the RTL-SDR blog describing how to build a V-dipole antenna to receive NOAA APT transmissions. With the multipurpose dipole antenna kit that can be ordered with the RTL-SDR, it is quite easy and cheap to build that V-dipole antenna.
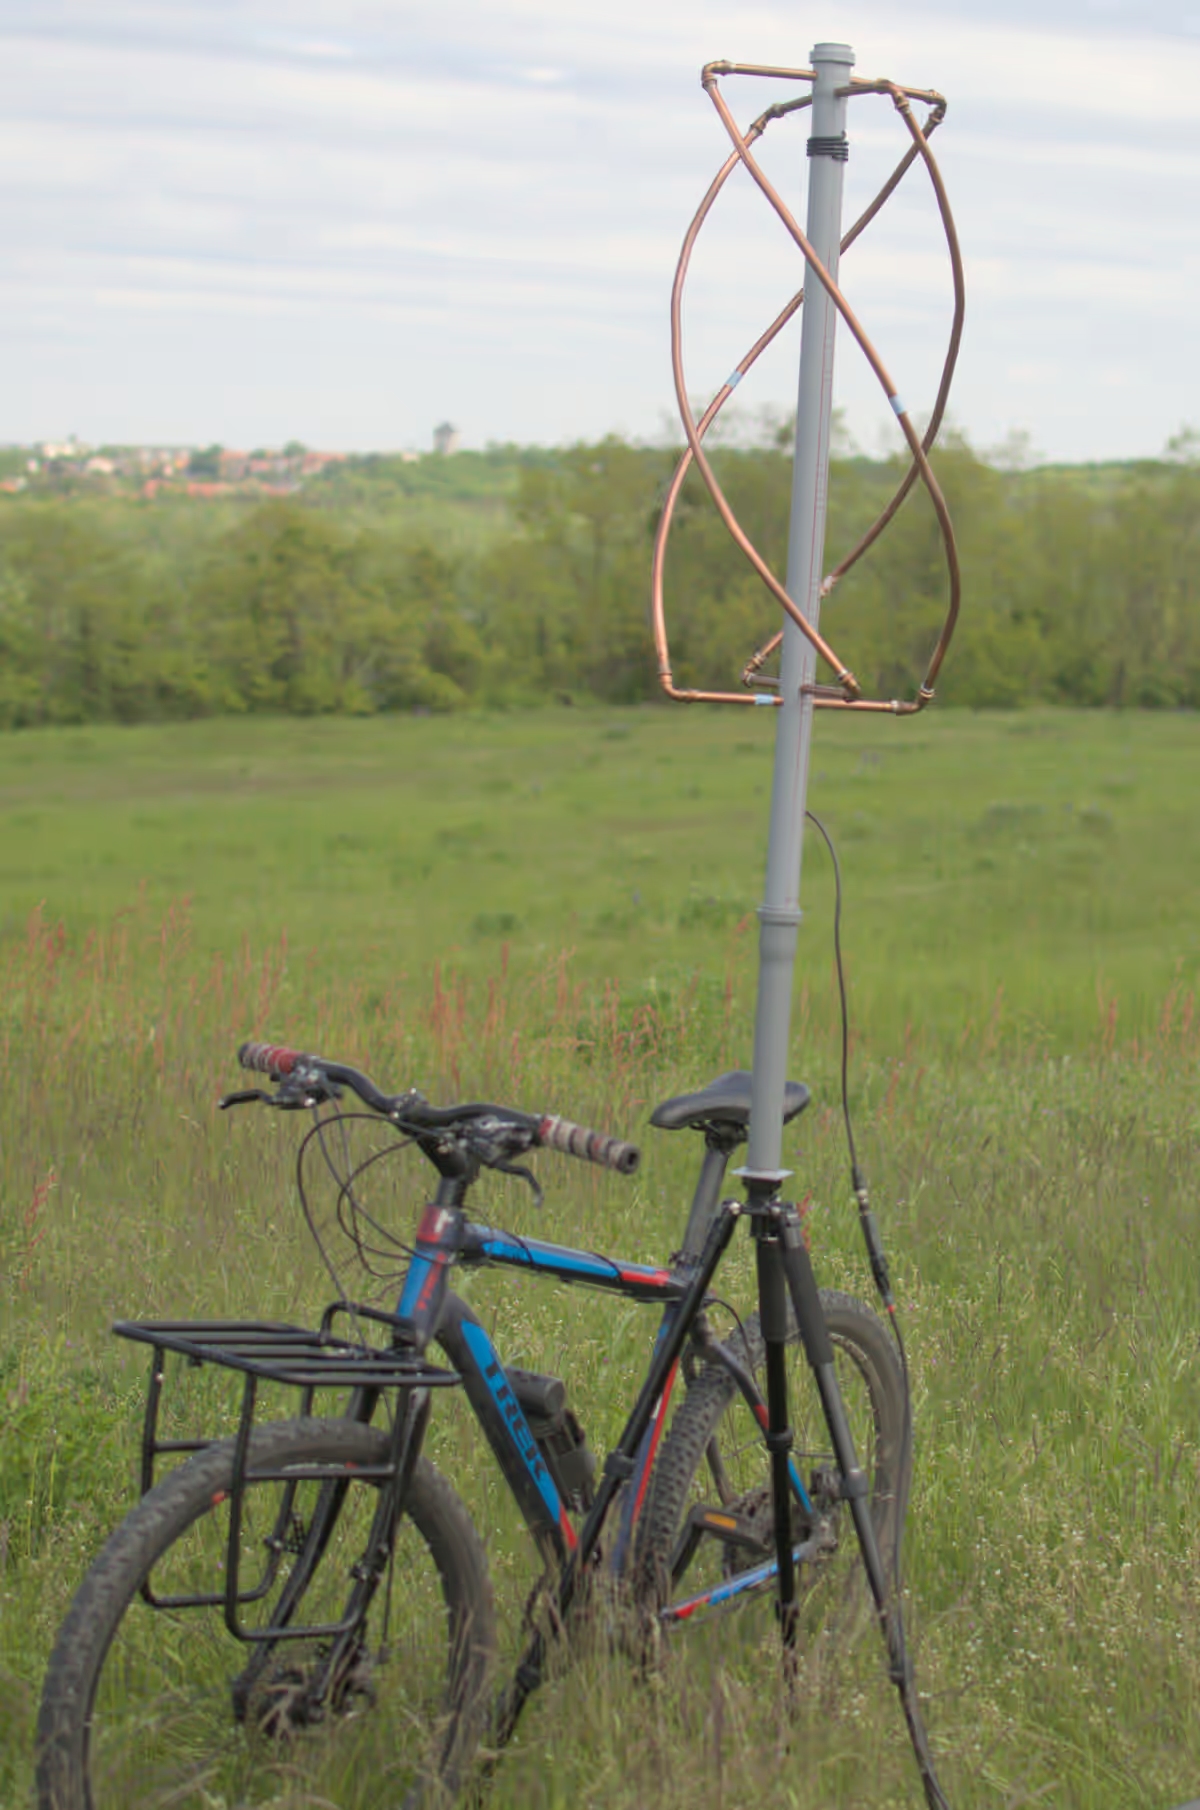
In any case, let’s take it a step further and take a look at an actual right-hand circularly polarized antenna: the quadrafilar helix antenna, also known as the QFH antenna.
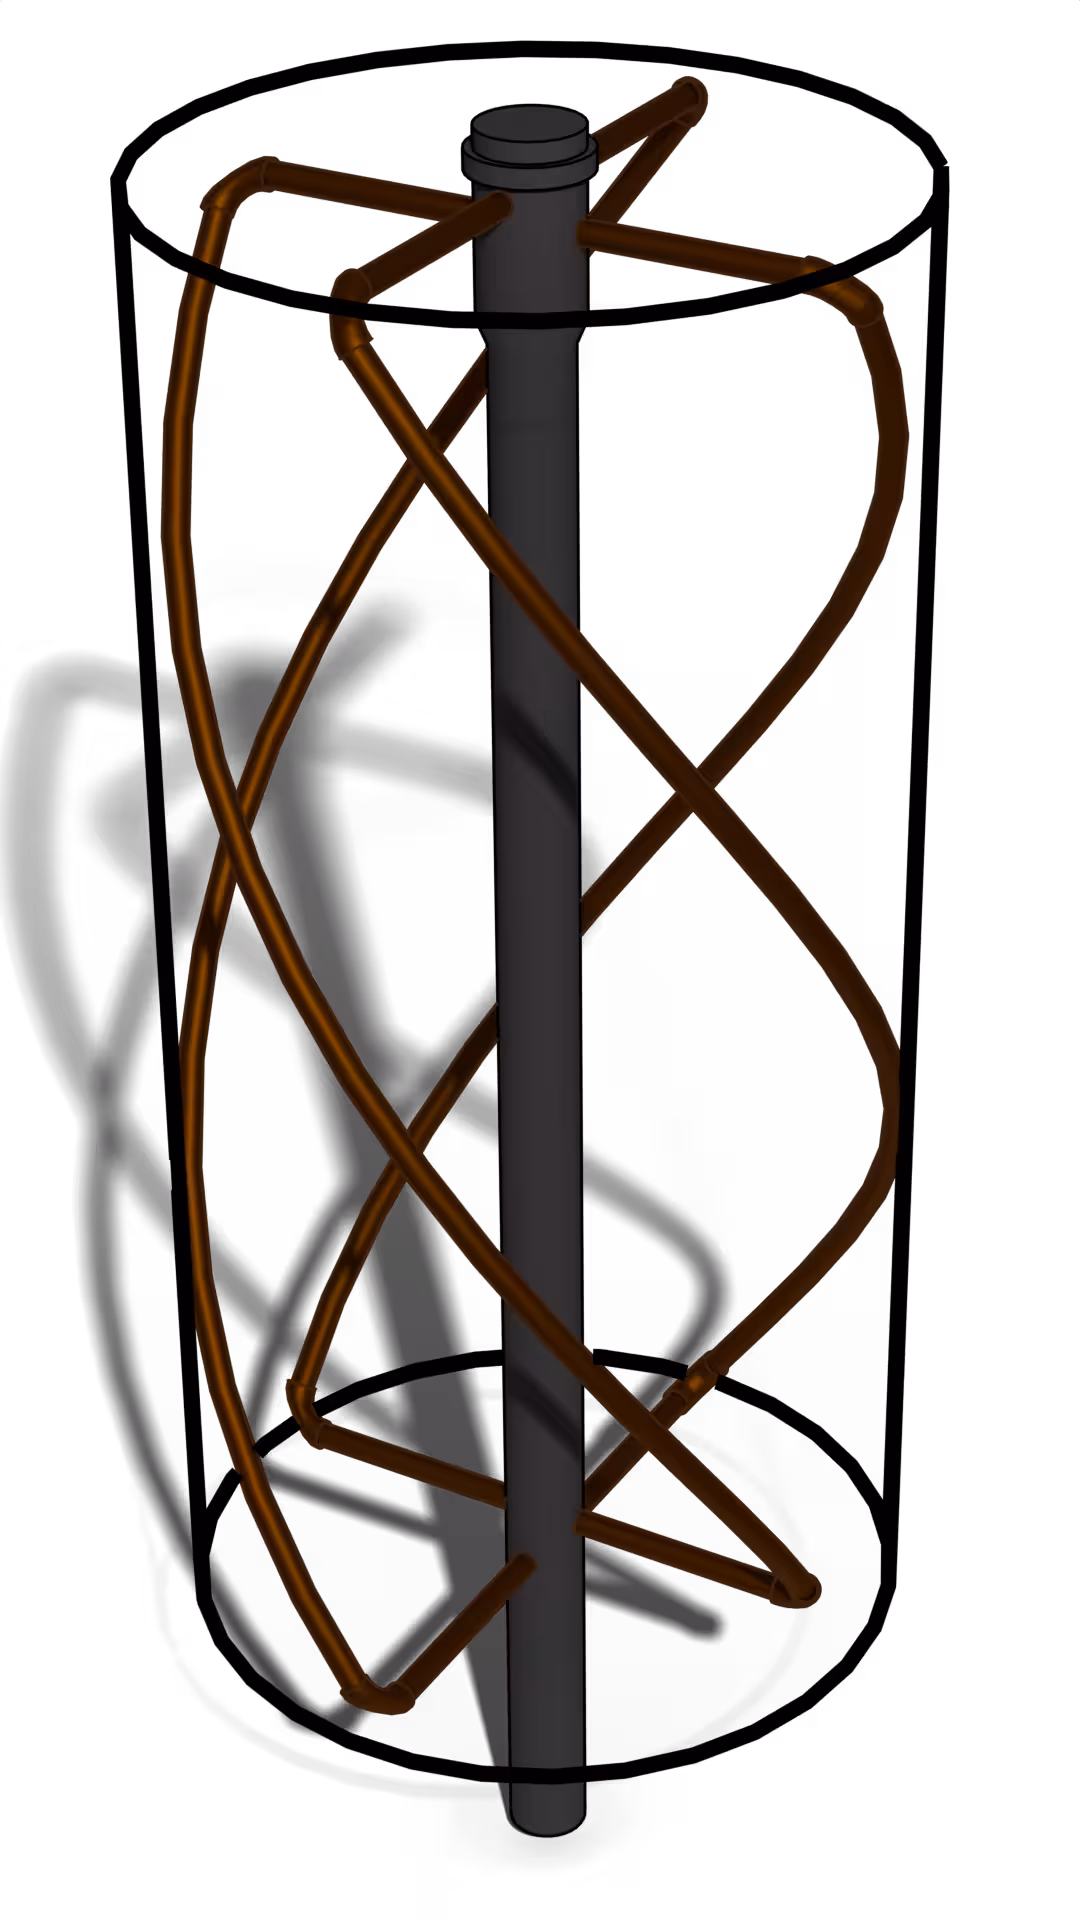
It consists of two loops, one smaller and one larger. They are offset from each other by 90 degrees and rotated by half a turn around the vertical axis of the antenna.
Given the length of each loop, how can the diameter and helix length of the antenna be calculated?
First, there is one problem: The corners are probably going to be rounded, but it's much easier to calculate with straight corners. Correcting that is simple. The length of a loop with the same height and diameter, but straight corners is depending on the bending radius .
The diameter-to-height ratio of the cylinder is chosen to be 0.44 as described in different publications online. However, decreasing the ratio may result in a better coverage at the horizon. Given the total length of each loop and the diameter-to-height ratio, all other relevant dimensions can be calculated.
Finally with the corrected loop length and some basic math, the diameter, height and helix length can be calculated. Imagine a cylinder around the smaller and the larger loops of the antenna. The horizontal elements correspond to the cylinder's diameters, while the vertical elements are curved around its surface.
Let the diameter-to-height ratio be . Then and . With , it follows that and as well as .
Then how long should these loops be now? All three NOAA-POES satellites transmit at different frequencies around 137.5 MHz. The wavelength in free space is calculated as follows: where is the speed of light and is the frequency.
There is an elongation factor for QFH antennas, which provides the length of the larger loop, as well as a deviation factor which is determined by experiment depending on the conductor's diameter and gives the length of the smaller loop.
| Diameter in mm | by R.W. Hollander | by Coppens | by R.W. Hollander | by Coppens |
|---|---|---|---|---|
| 4 | 4.6% | 6.8% | 1.3% | 1.7% |
| 8 | 6.7% | 7.1% | 2.8% | 2.5% |
| 12 | 7.2% | 7% | 2.5% | 3.6% |
| 15 | 7% | 6.8% | 3.3% | 4.9% |
Now the wavelength is and the two loops have the following properties
| Small loop | Large loop | |
|---|---|---|
| Length | ||
| Length (adjusted for bending) | ||
| Diameter (without bending) | ||
| Diameter (with bending) | ||
| Height | ||
| Helix length (without bending) | ||
| Helix length (with bending) |
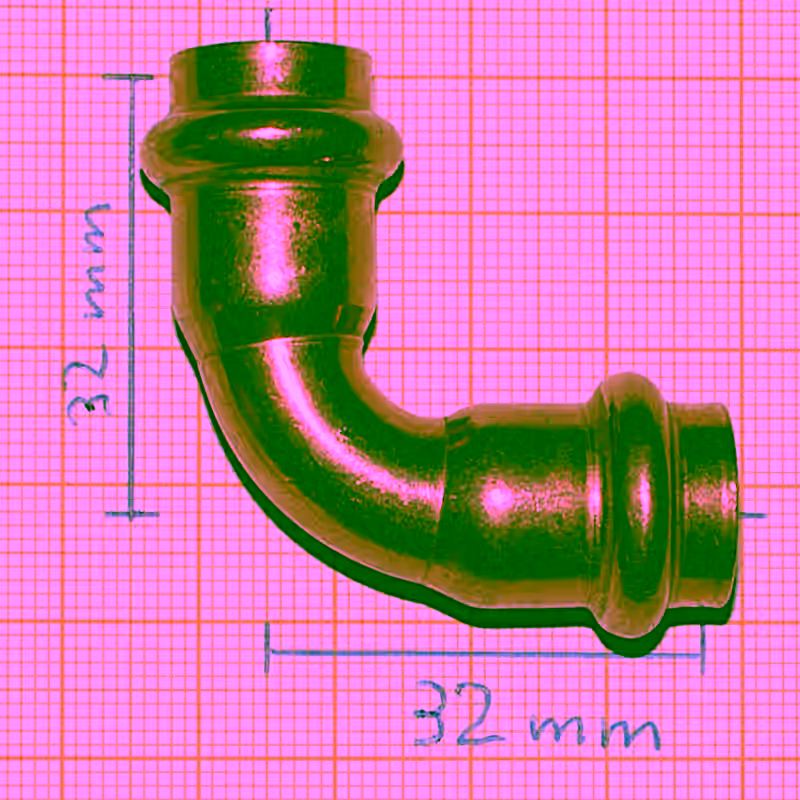
With all the necessary values ready, the antenna can finally be assembled. Copper tubing with a 12 mm diameter and a 40 mm diameter PVC pipe for the boom were purchased from the local hardware store for that purpose. The bending radius was determined to be 32 mm because those were the only right-angle joints available.
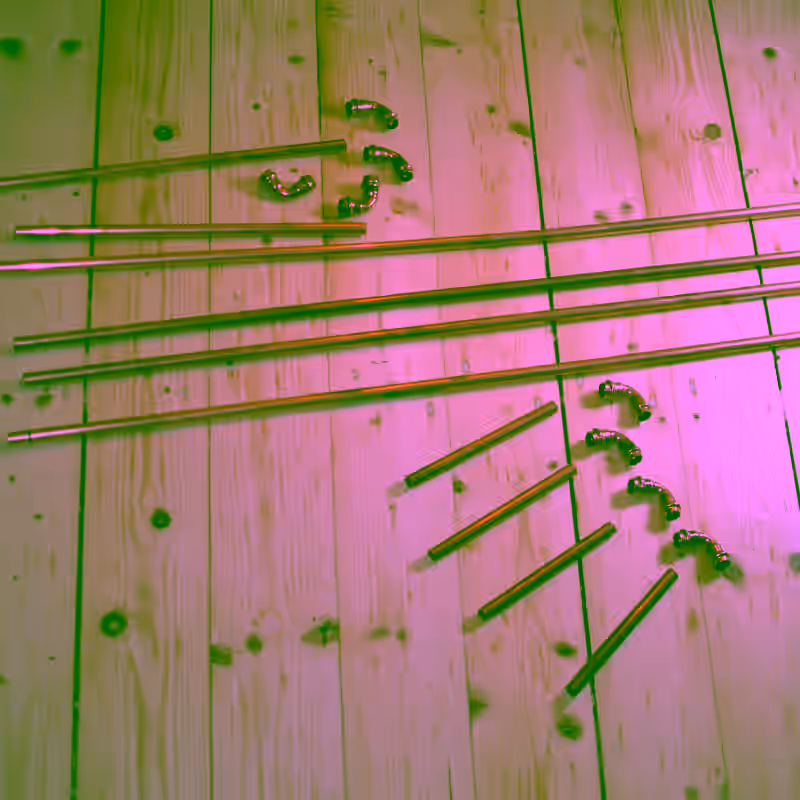
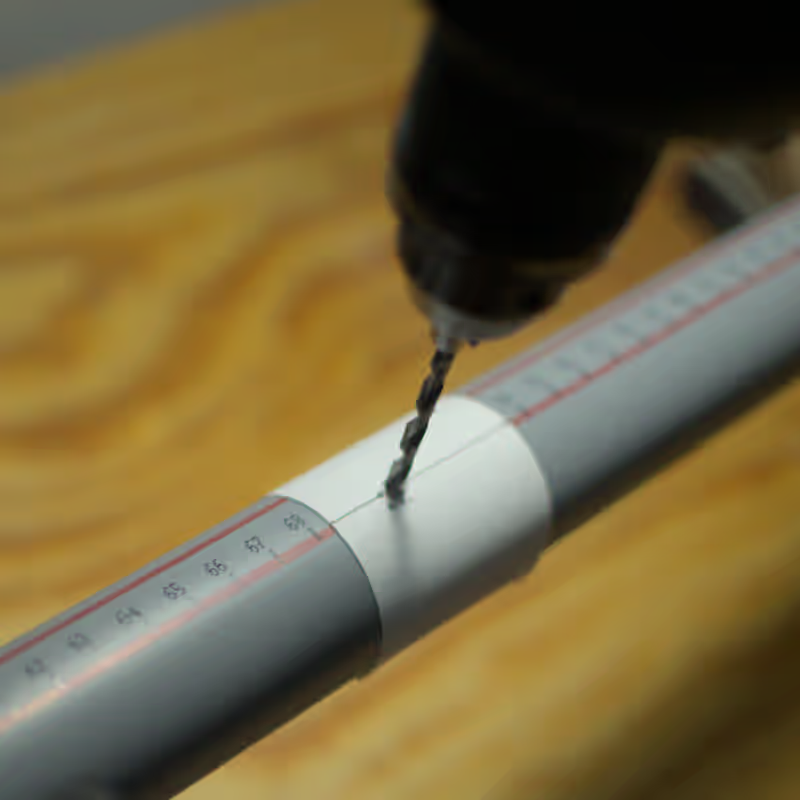
First, all of the elements were cut to the correct length. Next, holes were drilled into the PVC pipe, through which the copper elements were assembled. The elements are continuous at the bottom of the antenna, while they are electrically separated by a non-conducting piece of plastic at the top.
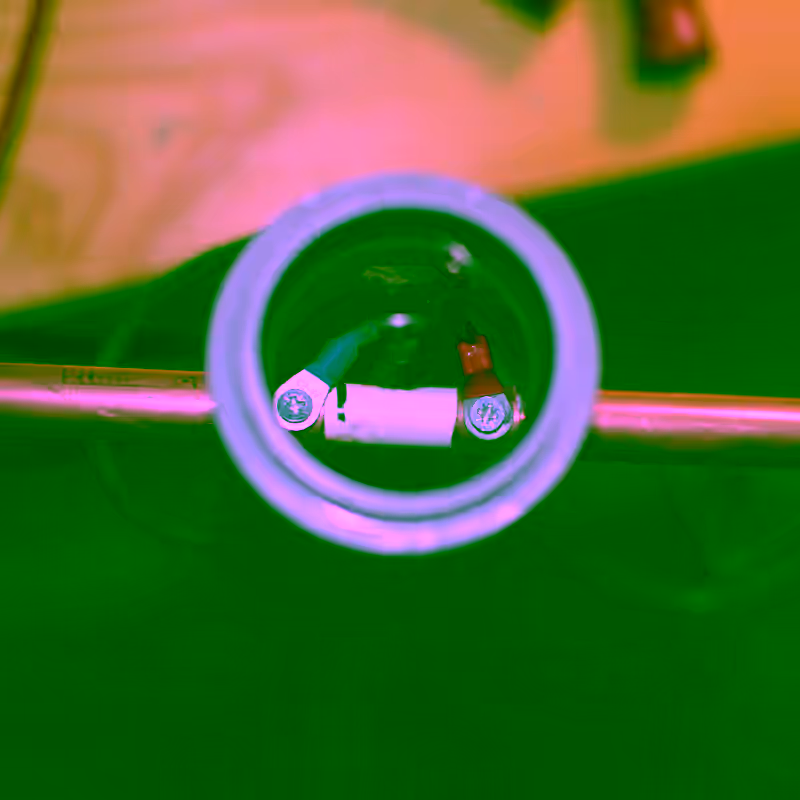
The wiring is straightforward. A piece of coaxial cable with a connector of your choice enters the boom near the top of the antenna. First, connect the center conductor and the shielding of the coaxial cable to each of the longer loops. Then, wire them in a clockwise direction to one of the shorter loops:
Setup a PC for receive operation
Finally, it’s time to set up the antenna and receive some birds.
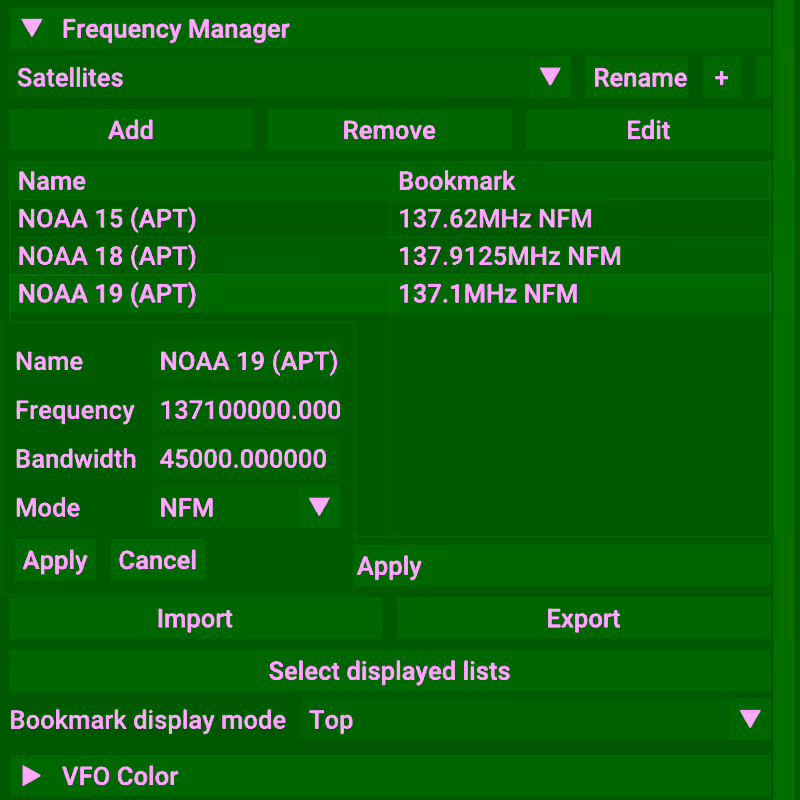
SDR++ will be used to record the satellite’s audio signal. But why focus on only one satellite when multiple satellites can be received at once? SDR++ is capable of operating multiple VFOs (variable frequency oscillators) simultaneously, enabling it to record two or three NOAA satellites that are passing by at the same time.
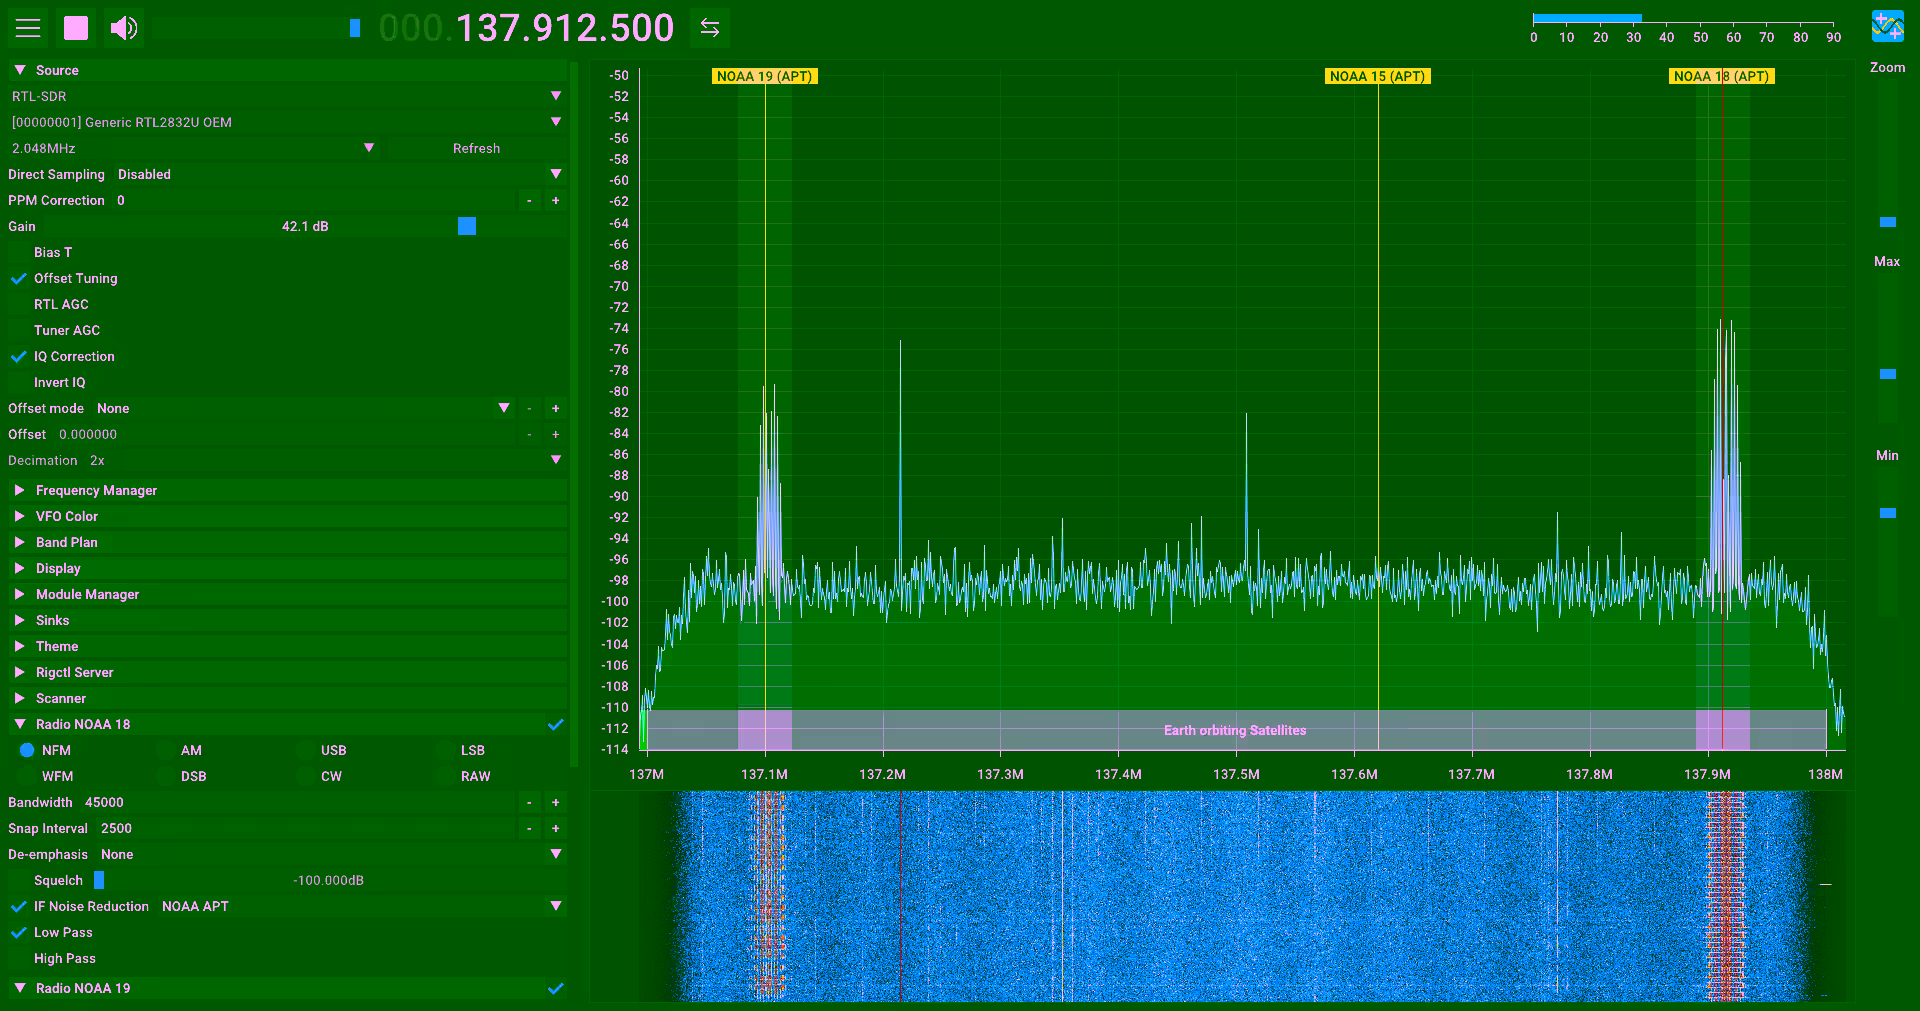
For ease of use, the appropriate frequencies for the satellites should be entered into the frequency manager first. The transmissions themselves have a bandwidth of 34 kHz. However due to the satellites moving quite fast and the Doppler effect, the center frequency varies during a pass. Setting a broader bandwidth of 45 kHz eliminates the need to manually adjust each VFO to track the satellite.
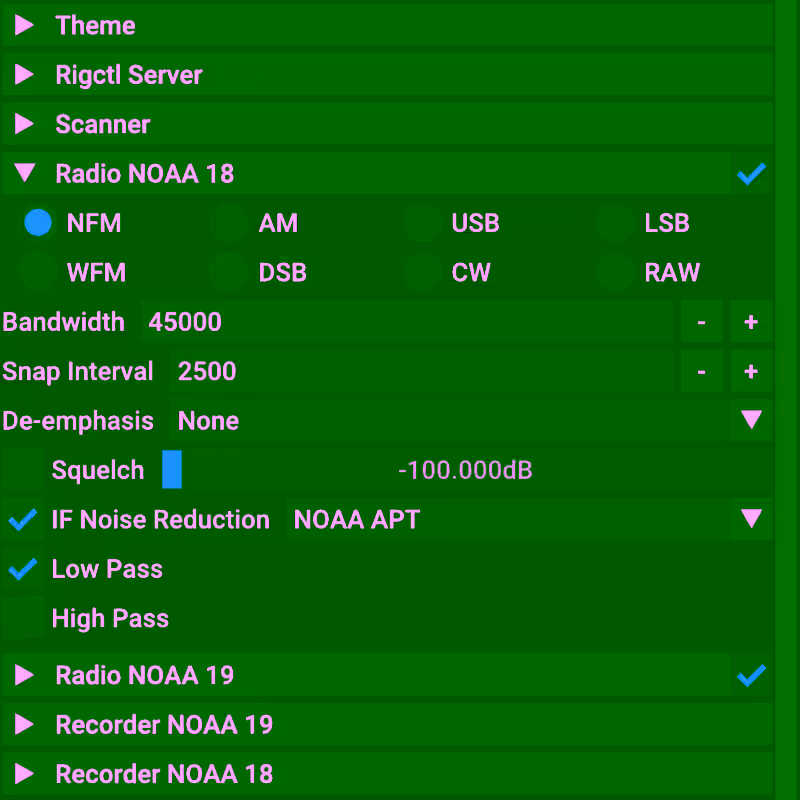
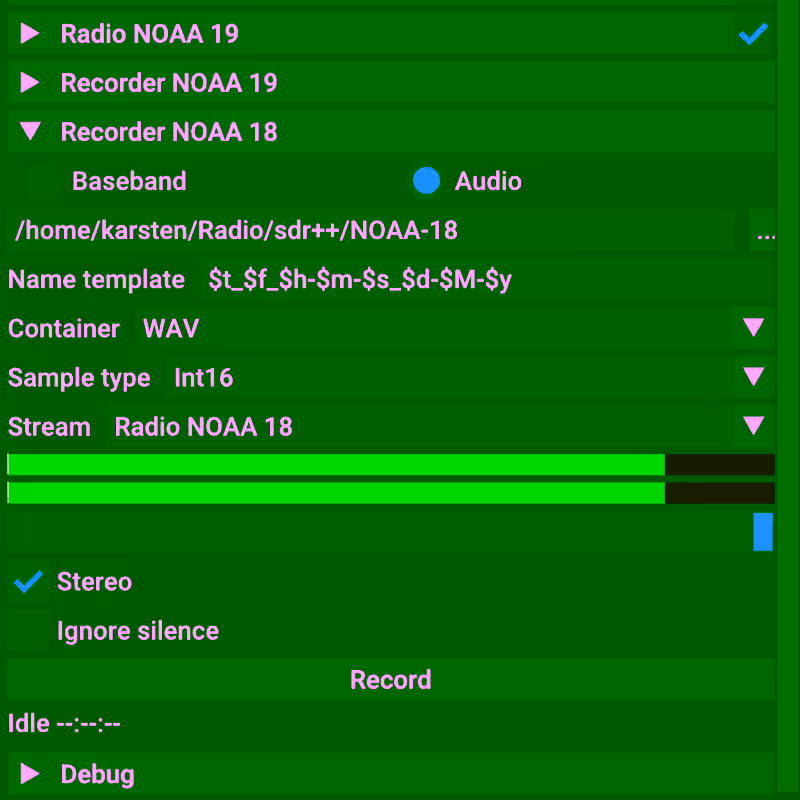
Next, in the module manager, two radios need to be configured to have two independent VFOs. Additionally, each radio also needs its own recorder.
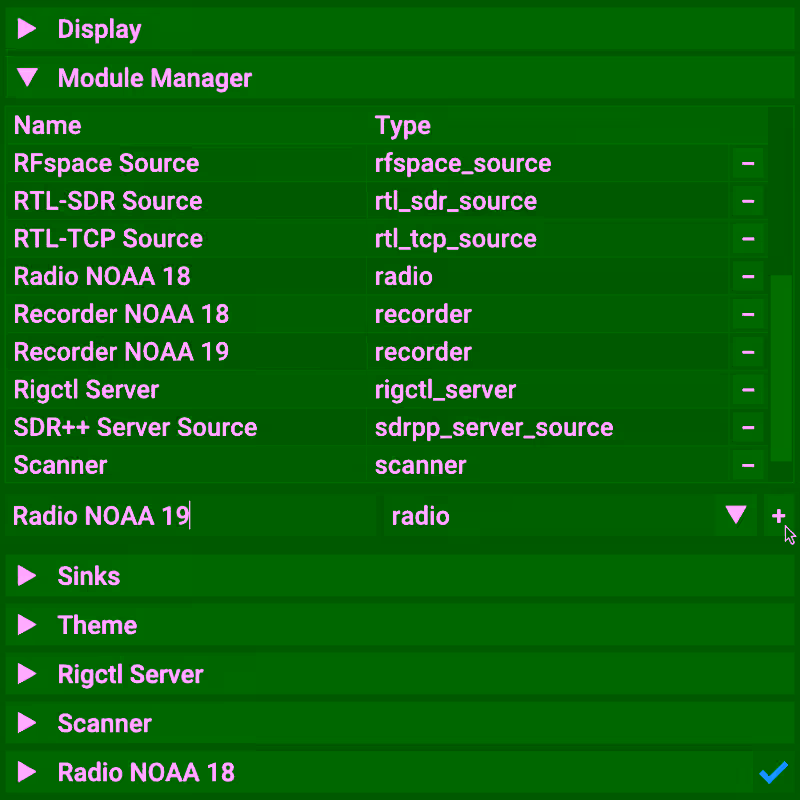
After that, enable the additional noise reduction filter for NOAA APT in each radio module. And don’t forget to set the stream to the appropriate radio for each recorder.
Finally, set up the source module. It is advised that you enable decimation, which antialiases and downsamples the data from the SDR thus decreasing the available bandwidth. However, this should improve the signal-to-noise ratio (SNR) by about 3 dB for each doubling of the decimation. With a sampling rate of and a decimation of 2, there is still enough bandwidth left to receive all three NOAA satellites simultaneously.
Now each of the three NOAA satellites carries an advanced very-high-resolution radiometer (AVHRR/3), which scans the Earth in six channels. The data transmitted via the APT system contains two of these channels, typically one of the infrared spectrum between 10.3 and 11.3 micrometers and one from either near-visible infrared between 0.725 and 1 micrometers or mid-wave infrared between 3.55 - 3.93 micrometers, depending whether it’s daytime or nighttime.
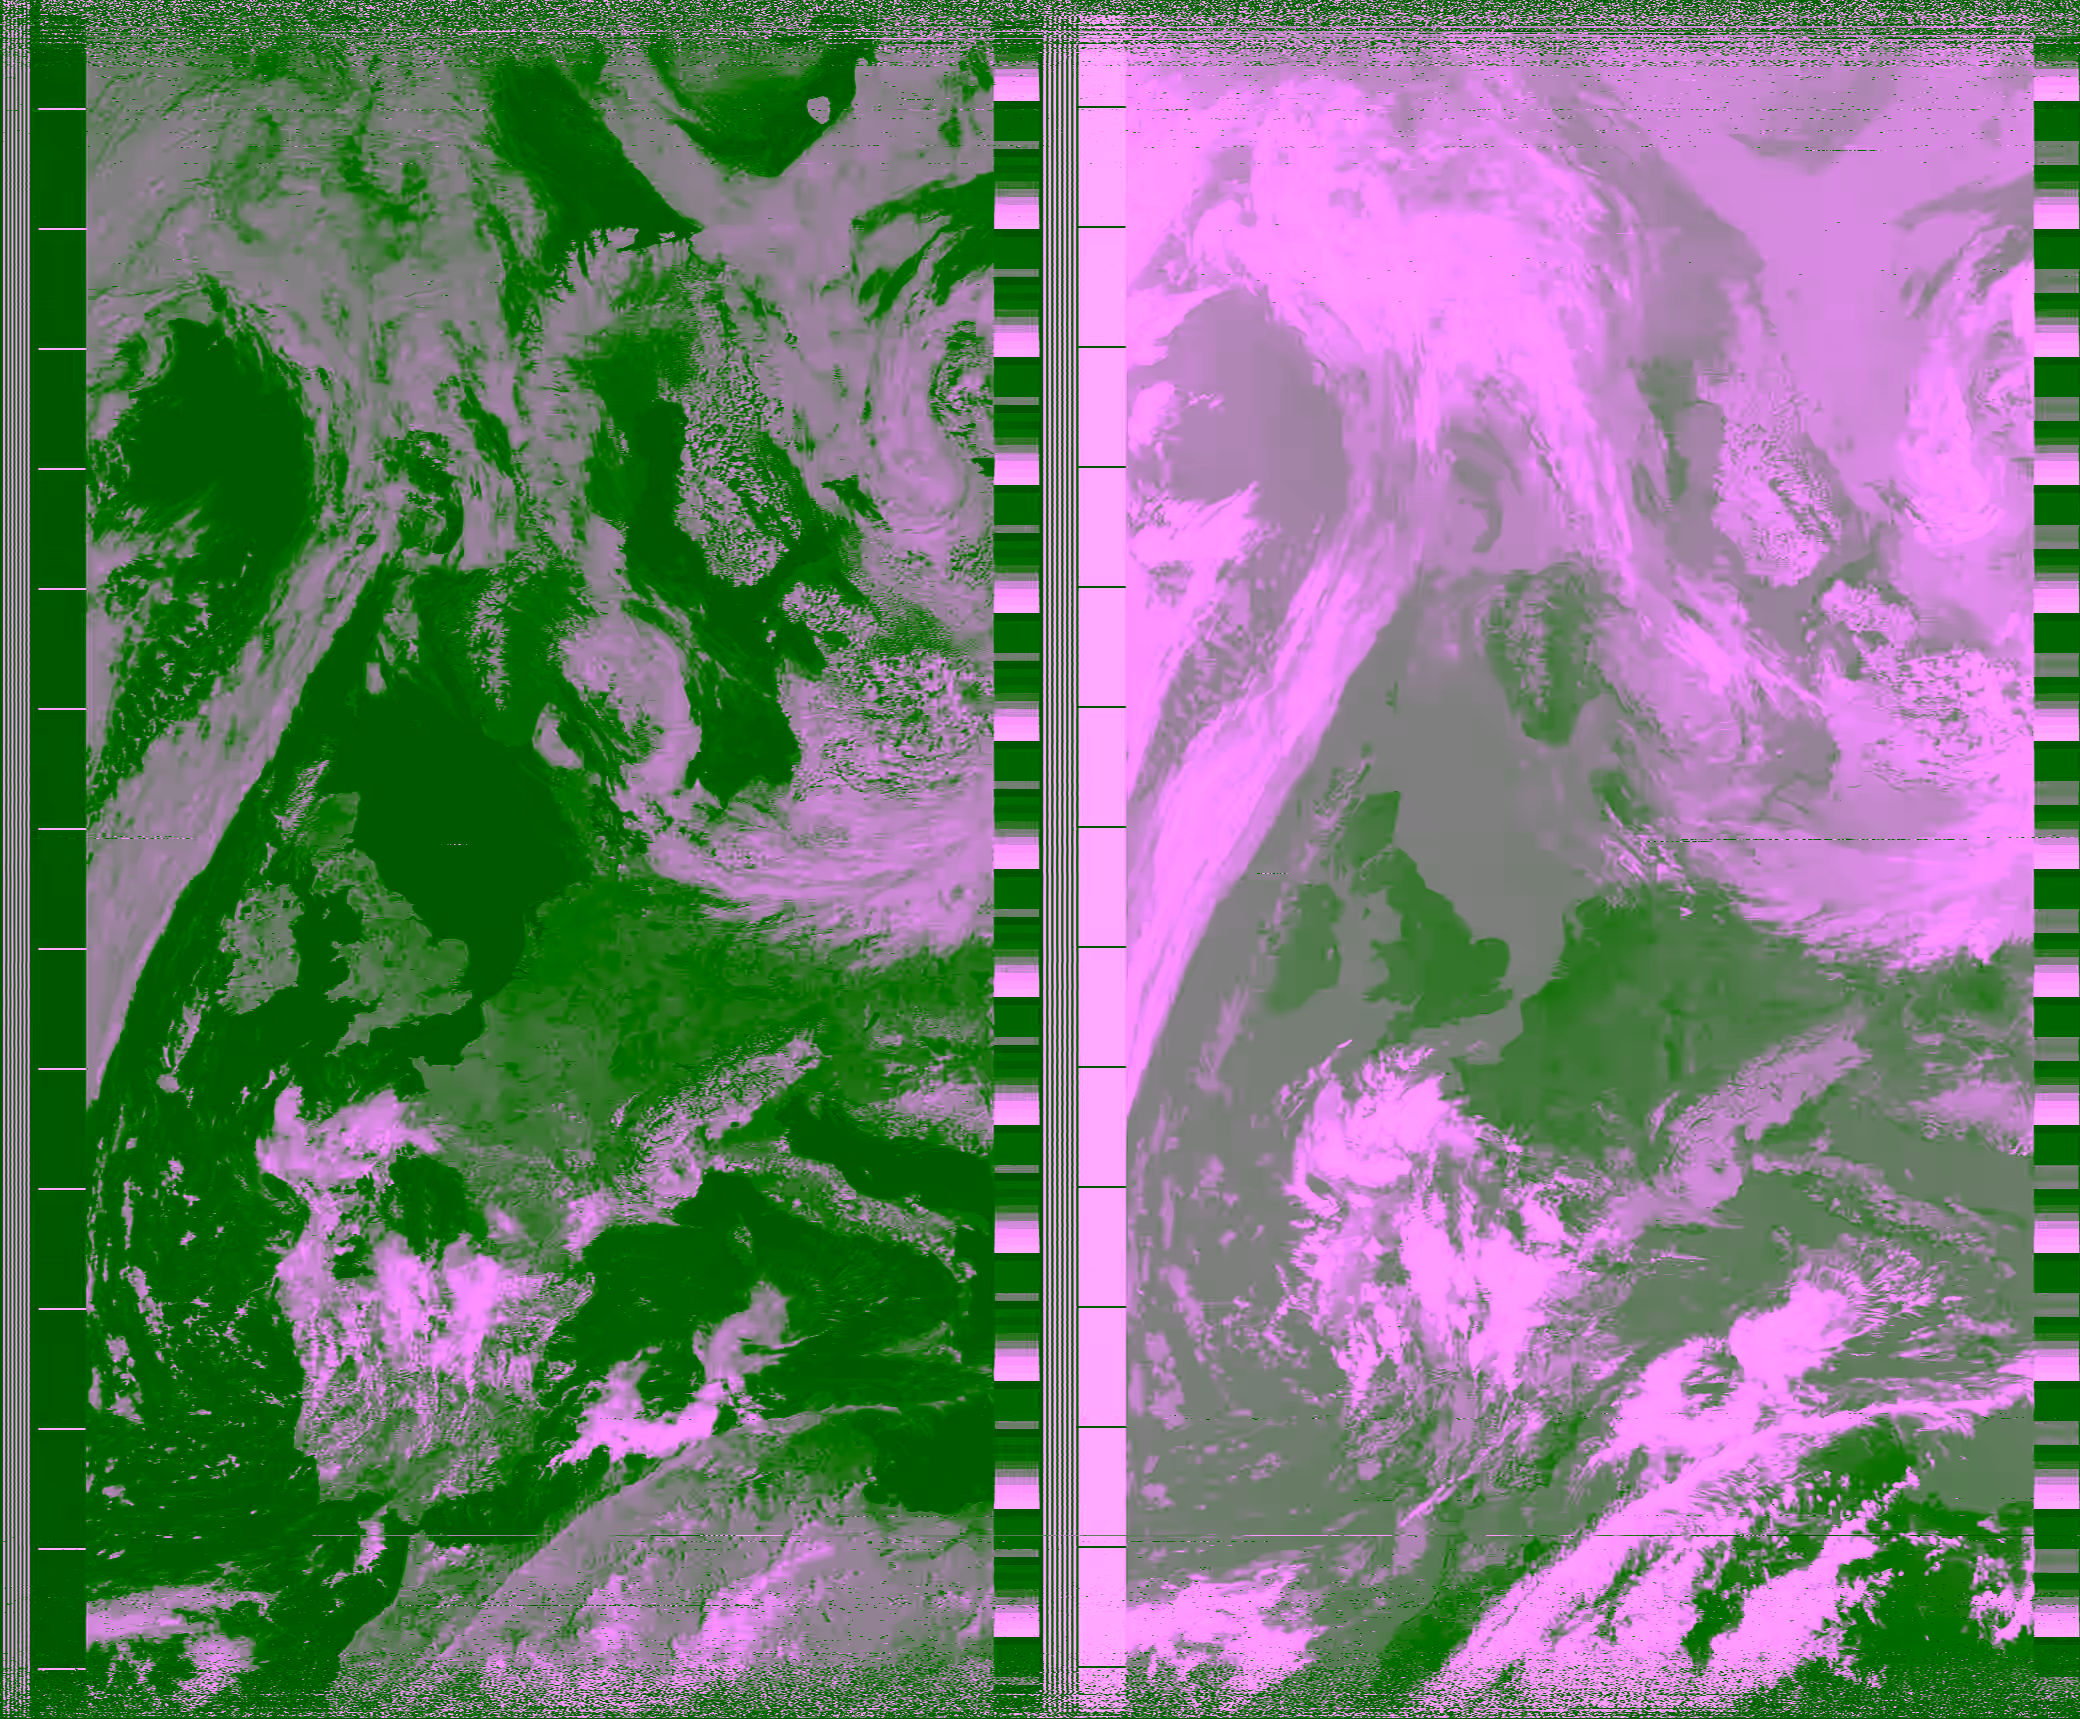
The vertical bars next to each image contain synchronization and telemetry information. Now each channel is only grayscale, but two channels can be combined to create enhanced composite images. A description of these enhancements can be found in the WXtoIMG manual.
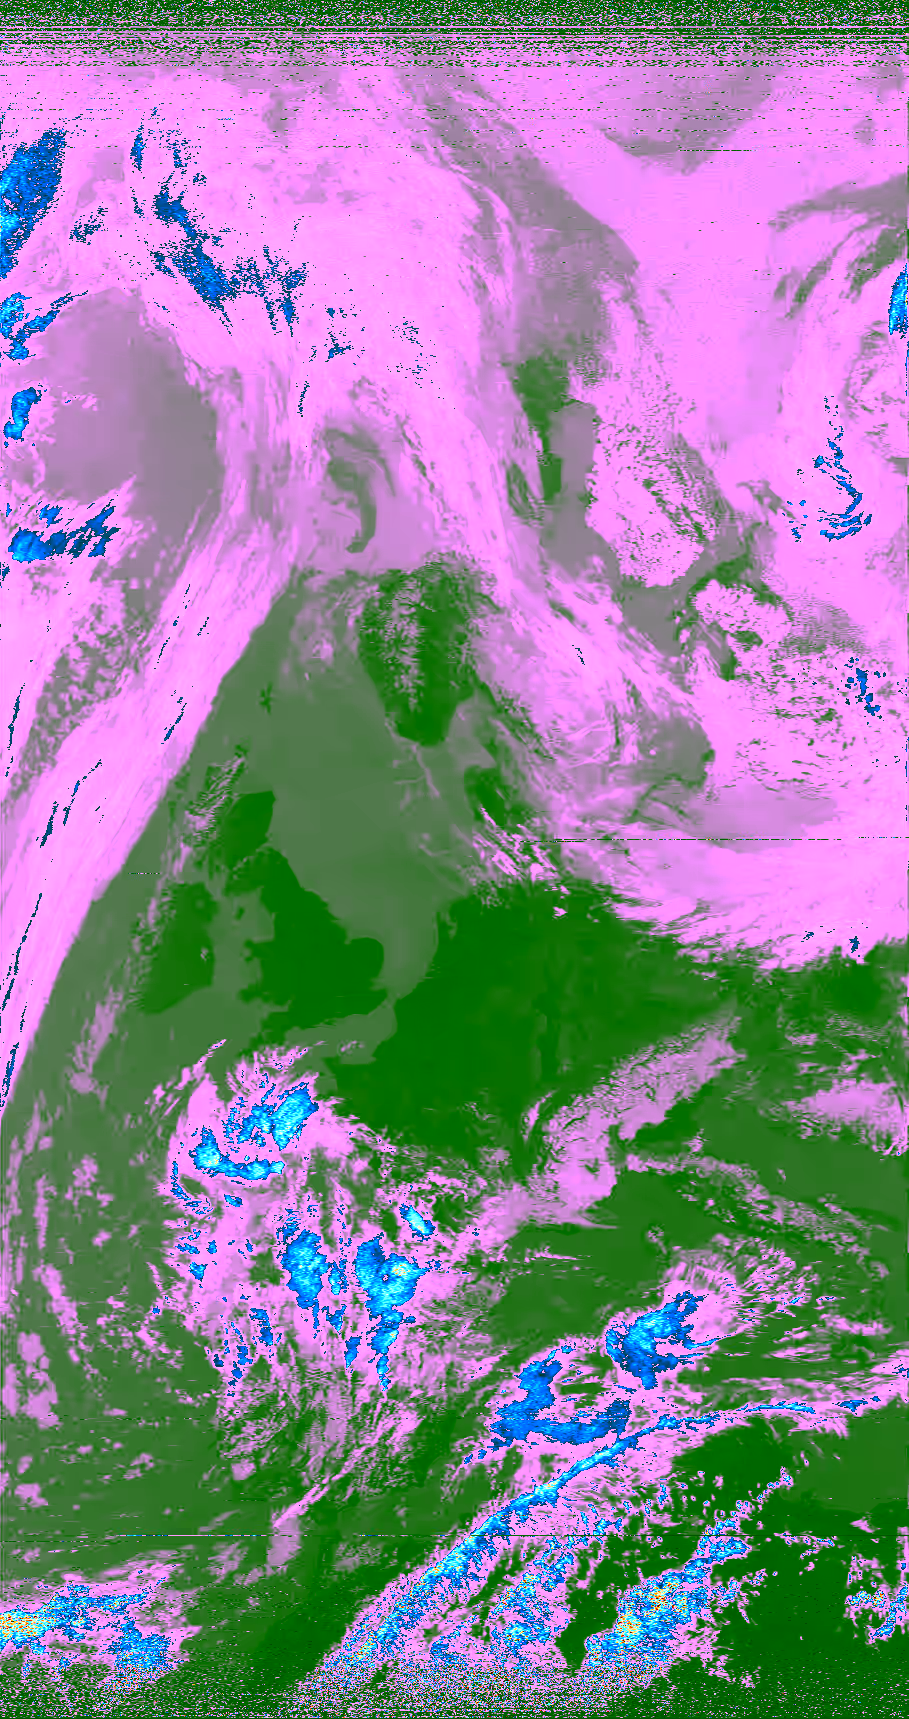
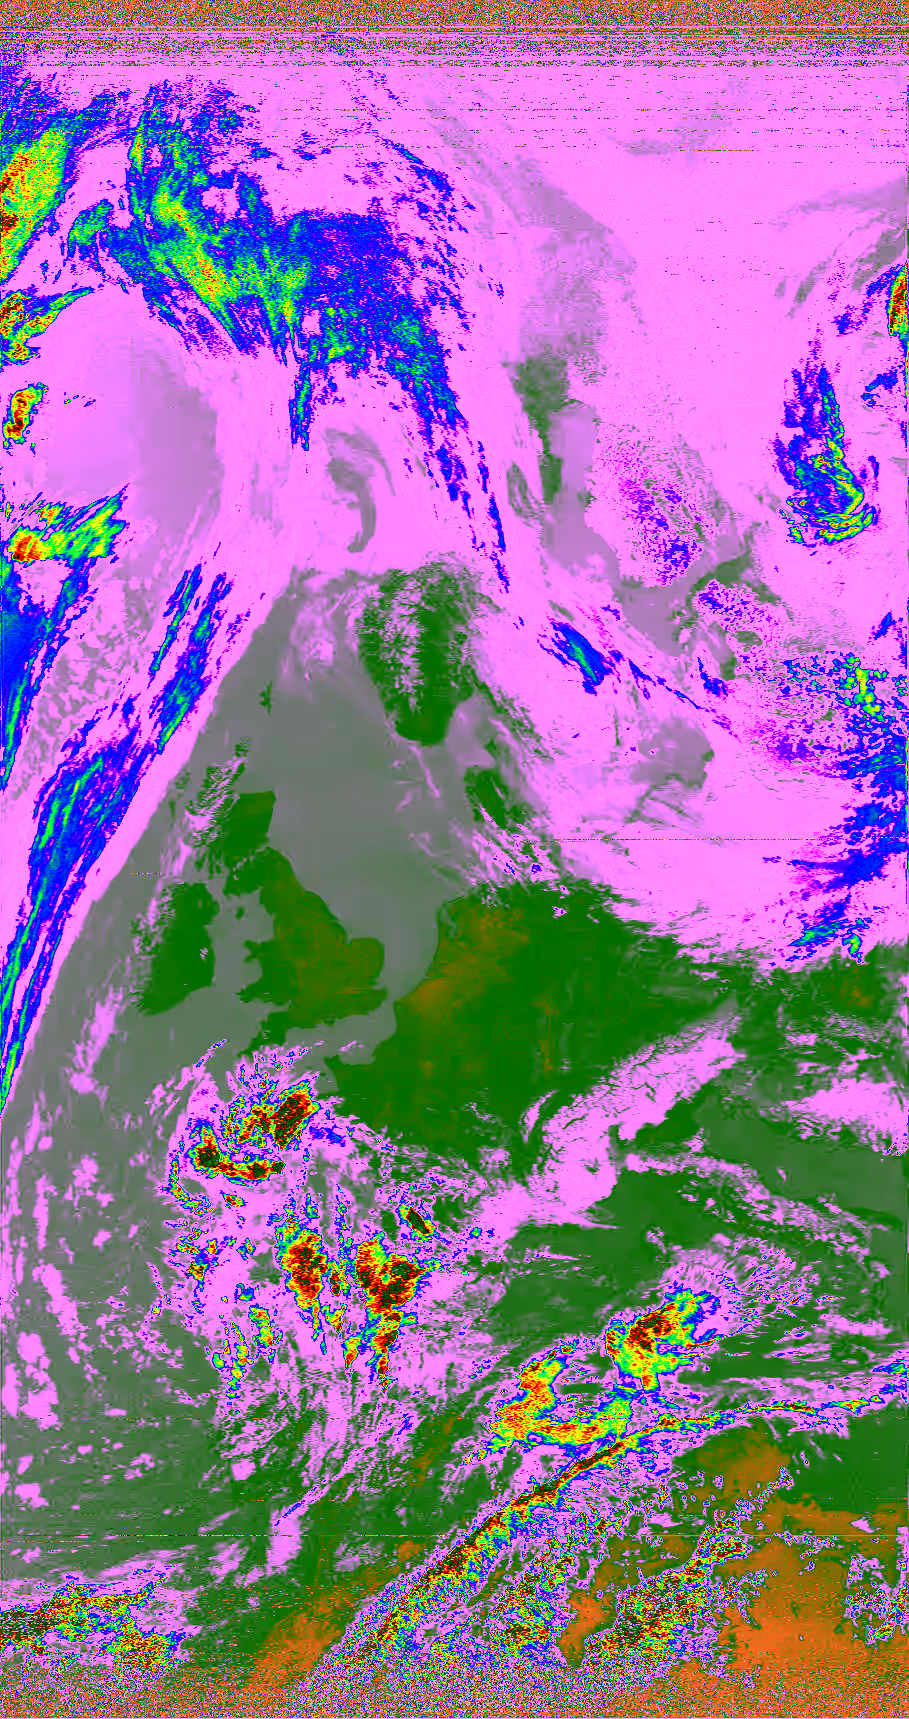
See the two images below for examples. The first image shows cold cloud top temperatures indicating heavy rainfall (clouptop enhancement), and the second image shows greatly increased IR contrast with cloud coloring (NO enhancement).
The process of decoding and projecting multiple transmissions together in SatDump is a bit more complicated and comprises some more steps. All of these steps are all documented in the following video:
And voilà! Here is the result. It’s still a bit blurry at the top and bottom since it’s an analog transmission.
Side note to Meteor-M N2-4
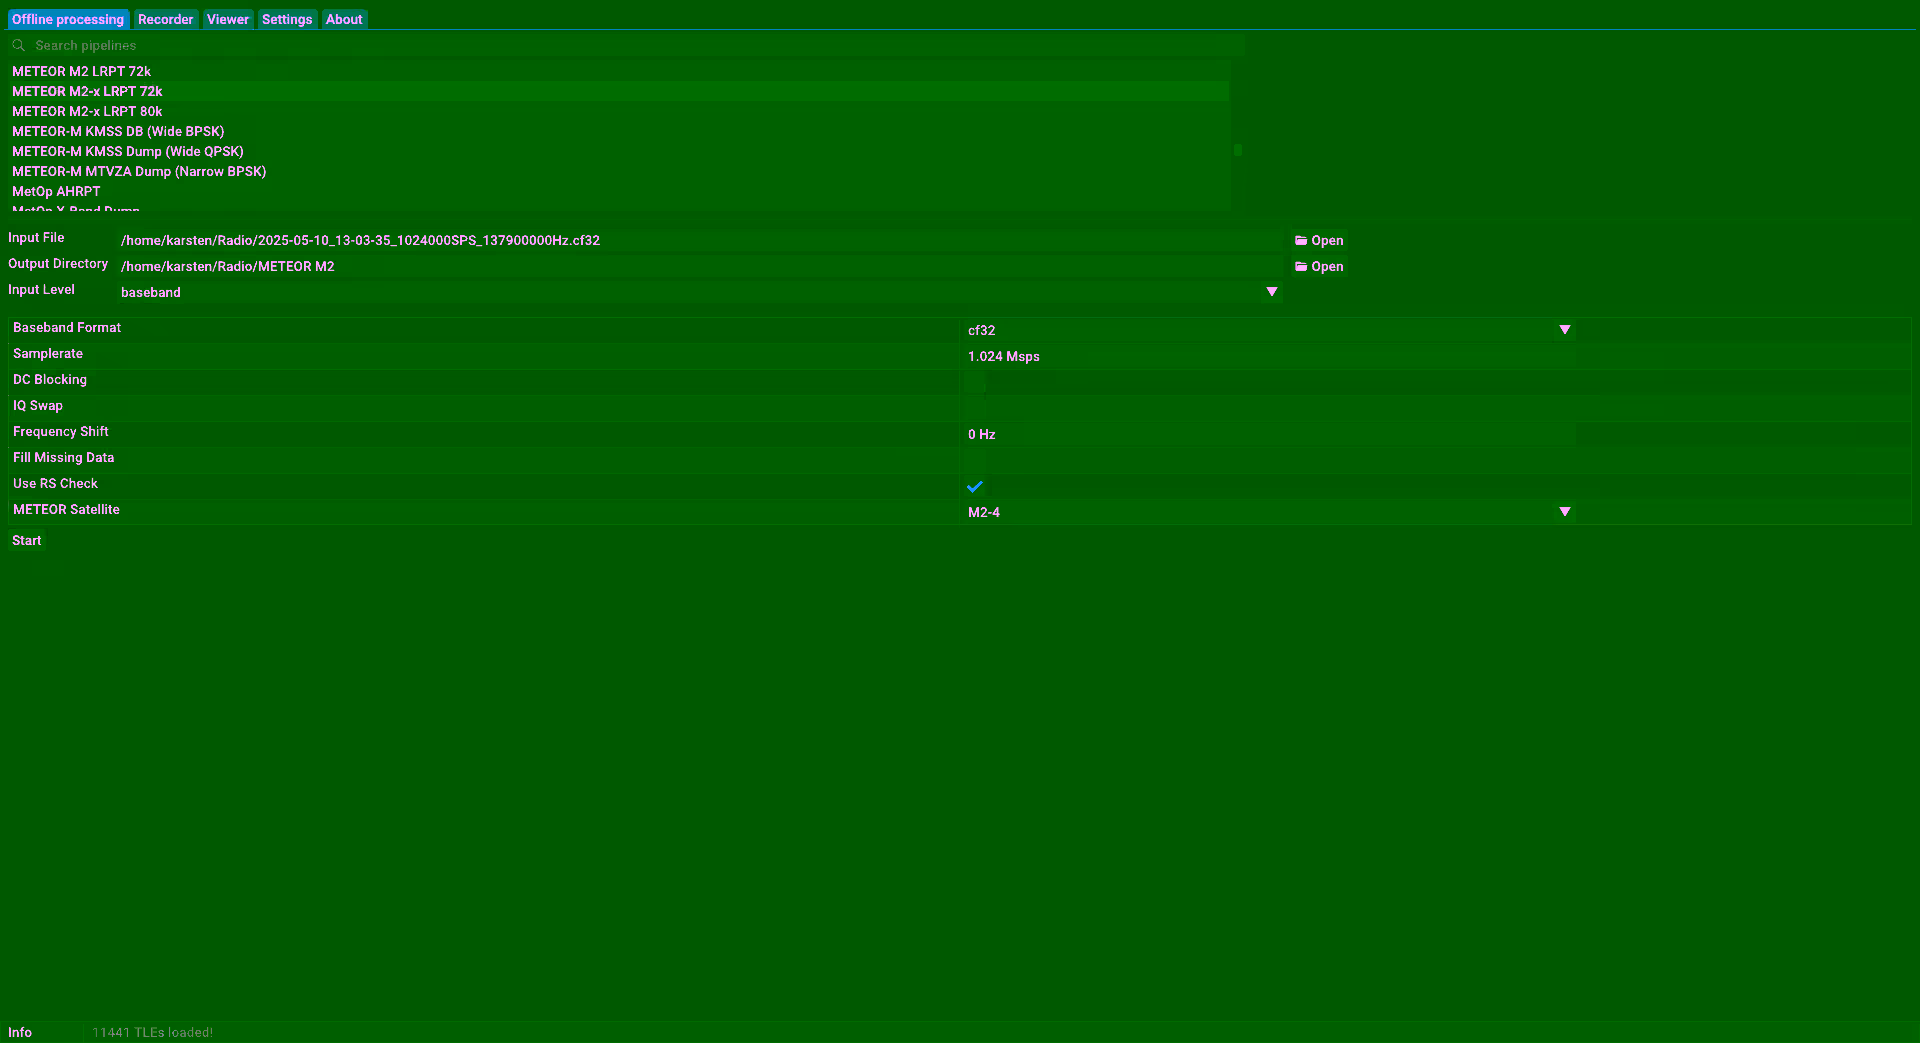
Aside from the 3 NOAA satellites, there is also a Russian weather satellite Meteor-M N2-4 transmitting around 137 MHz. Instead of the analog APT, it uses digital low rate picture transmission (LRPT) with quadrature phase shift keying modulation, so recording an audio file to decode it later won’t work here. Instead directly record the baseband in SatDump. Go to the Recording tab, select Meteor M2-x LRPT 72k, choose the primary frequency for 137.9 MHz, click Start and when the signal can be seen in the waterfall or the demodulator in the bottom shows four green dots, start the recording.
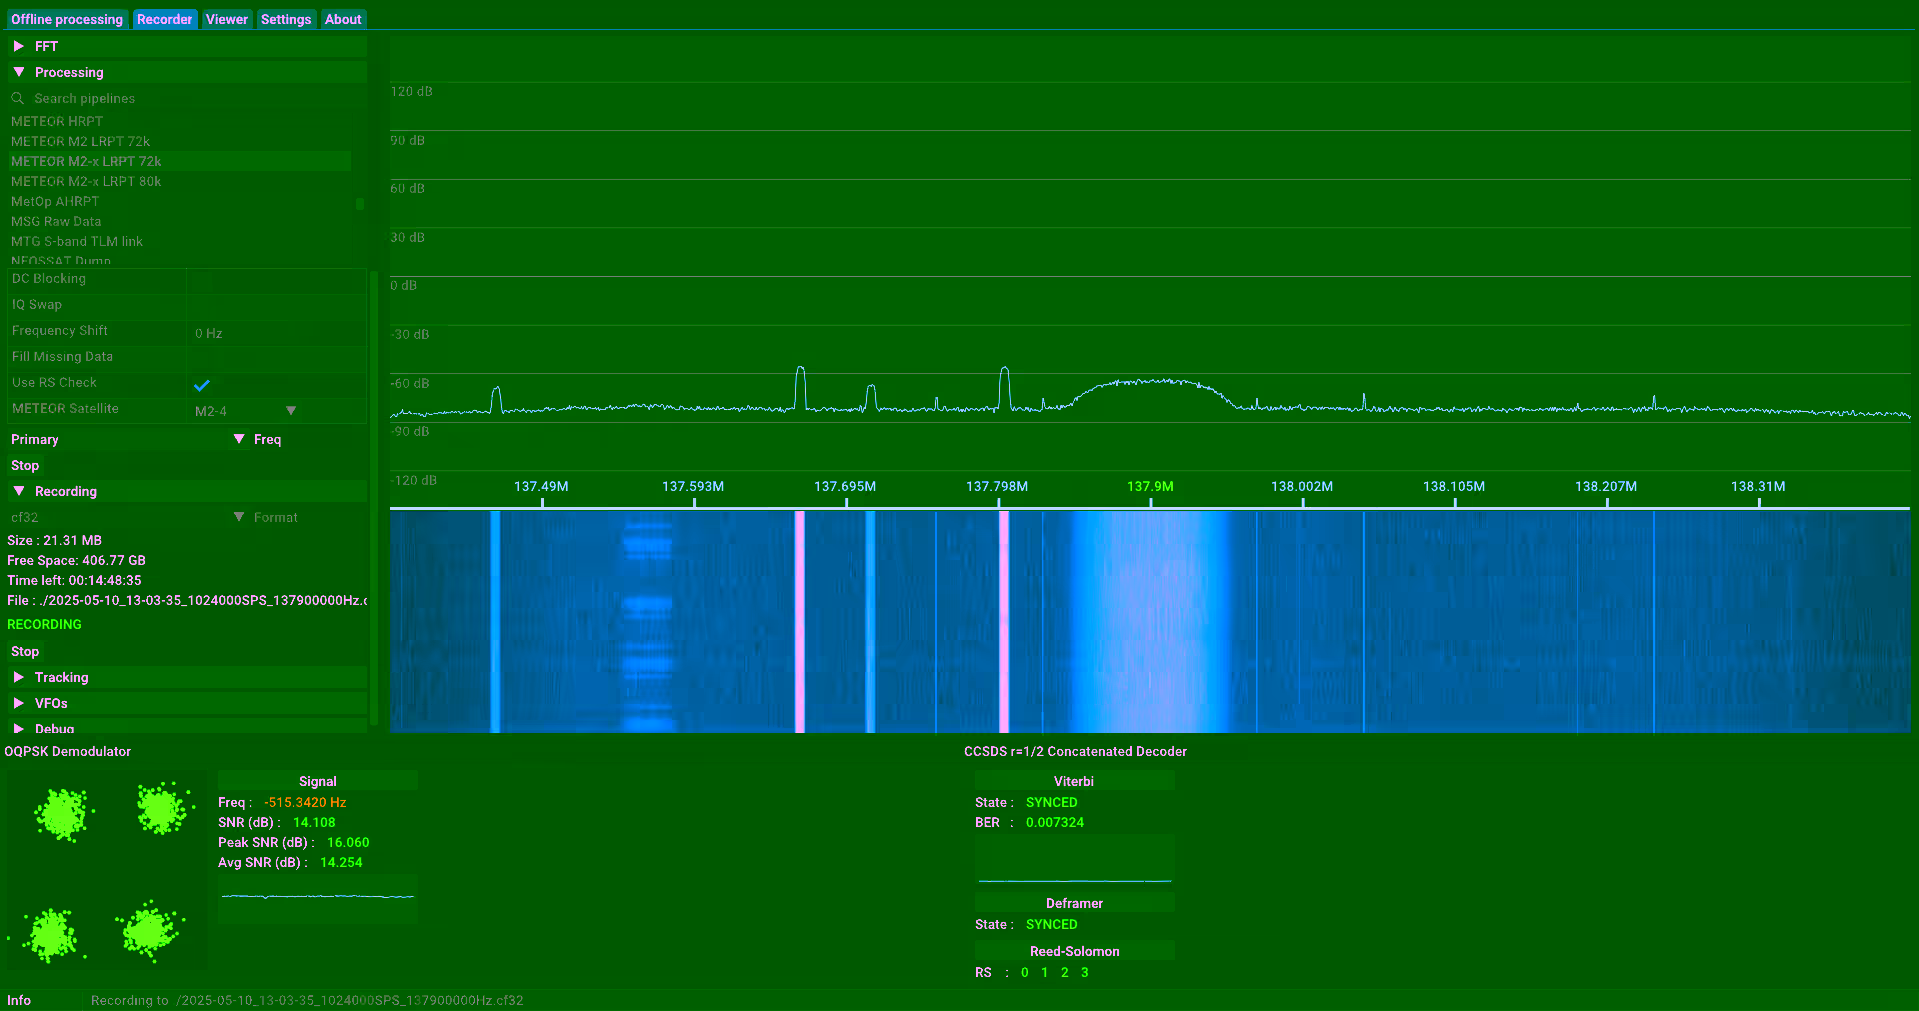
Later in the Offline Processing tab, select Meteor M2-x LRPT 72k again and open the previously created recording. The Input level, Baseband Format and Samplerate fields will then be filled in automatically with the appropriate values. Finally select an Output Directory and start decoding the signal.
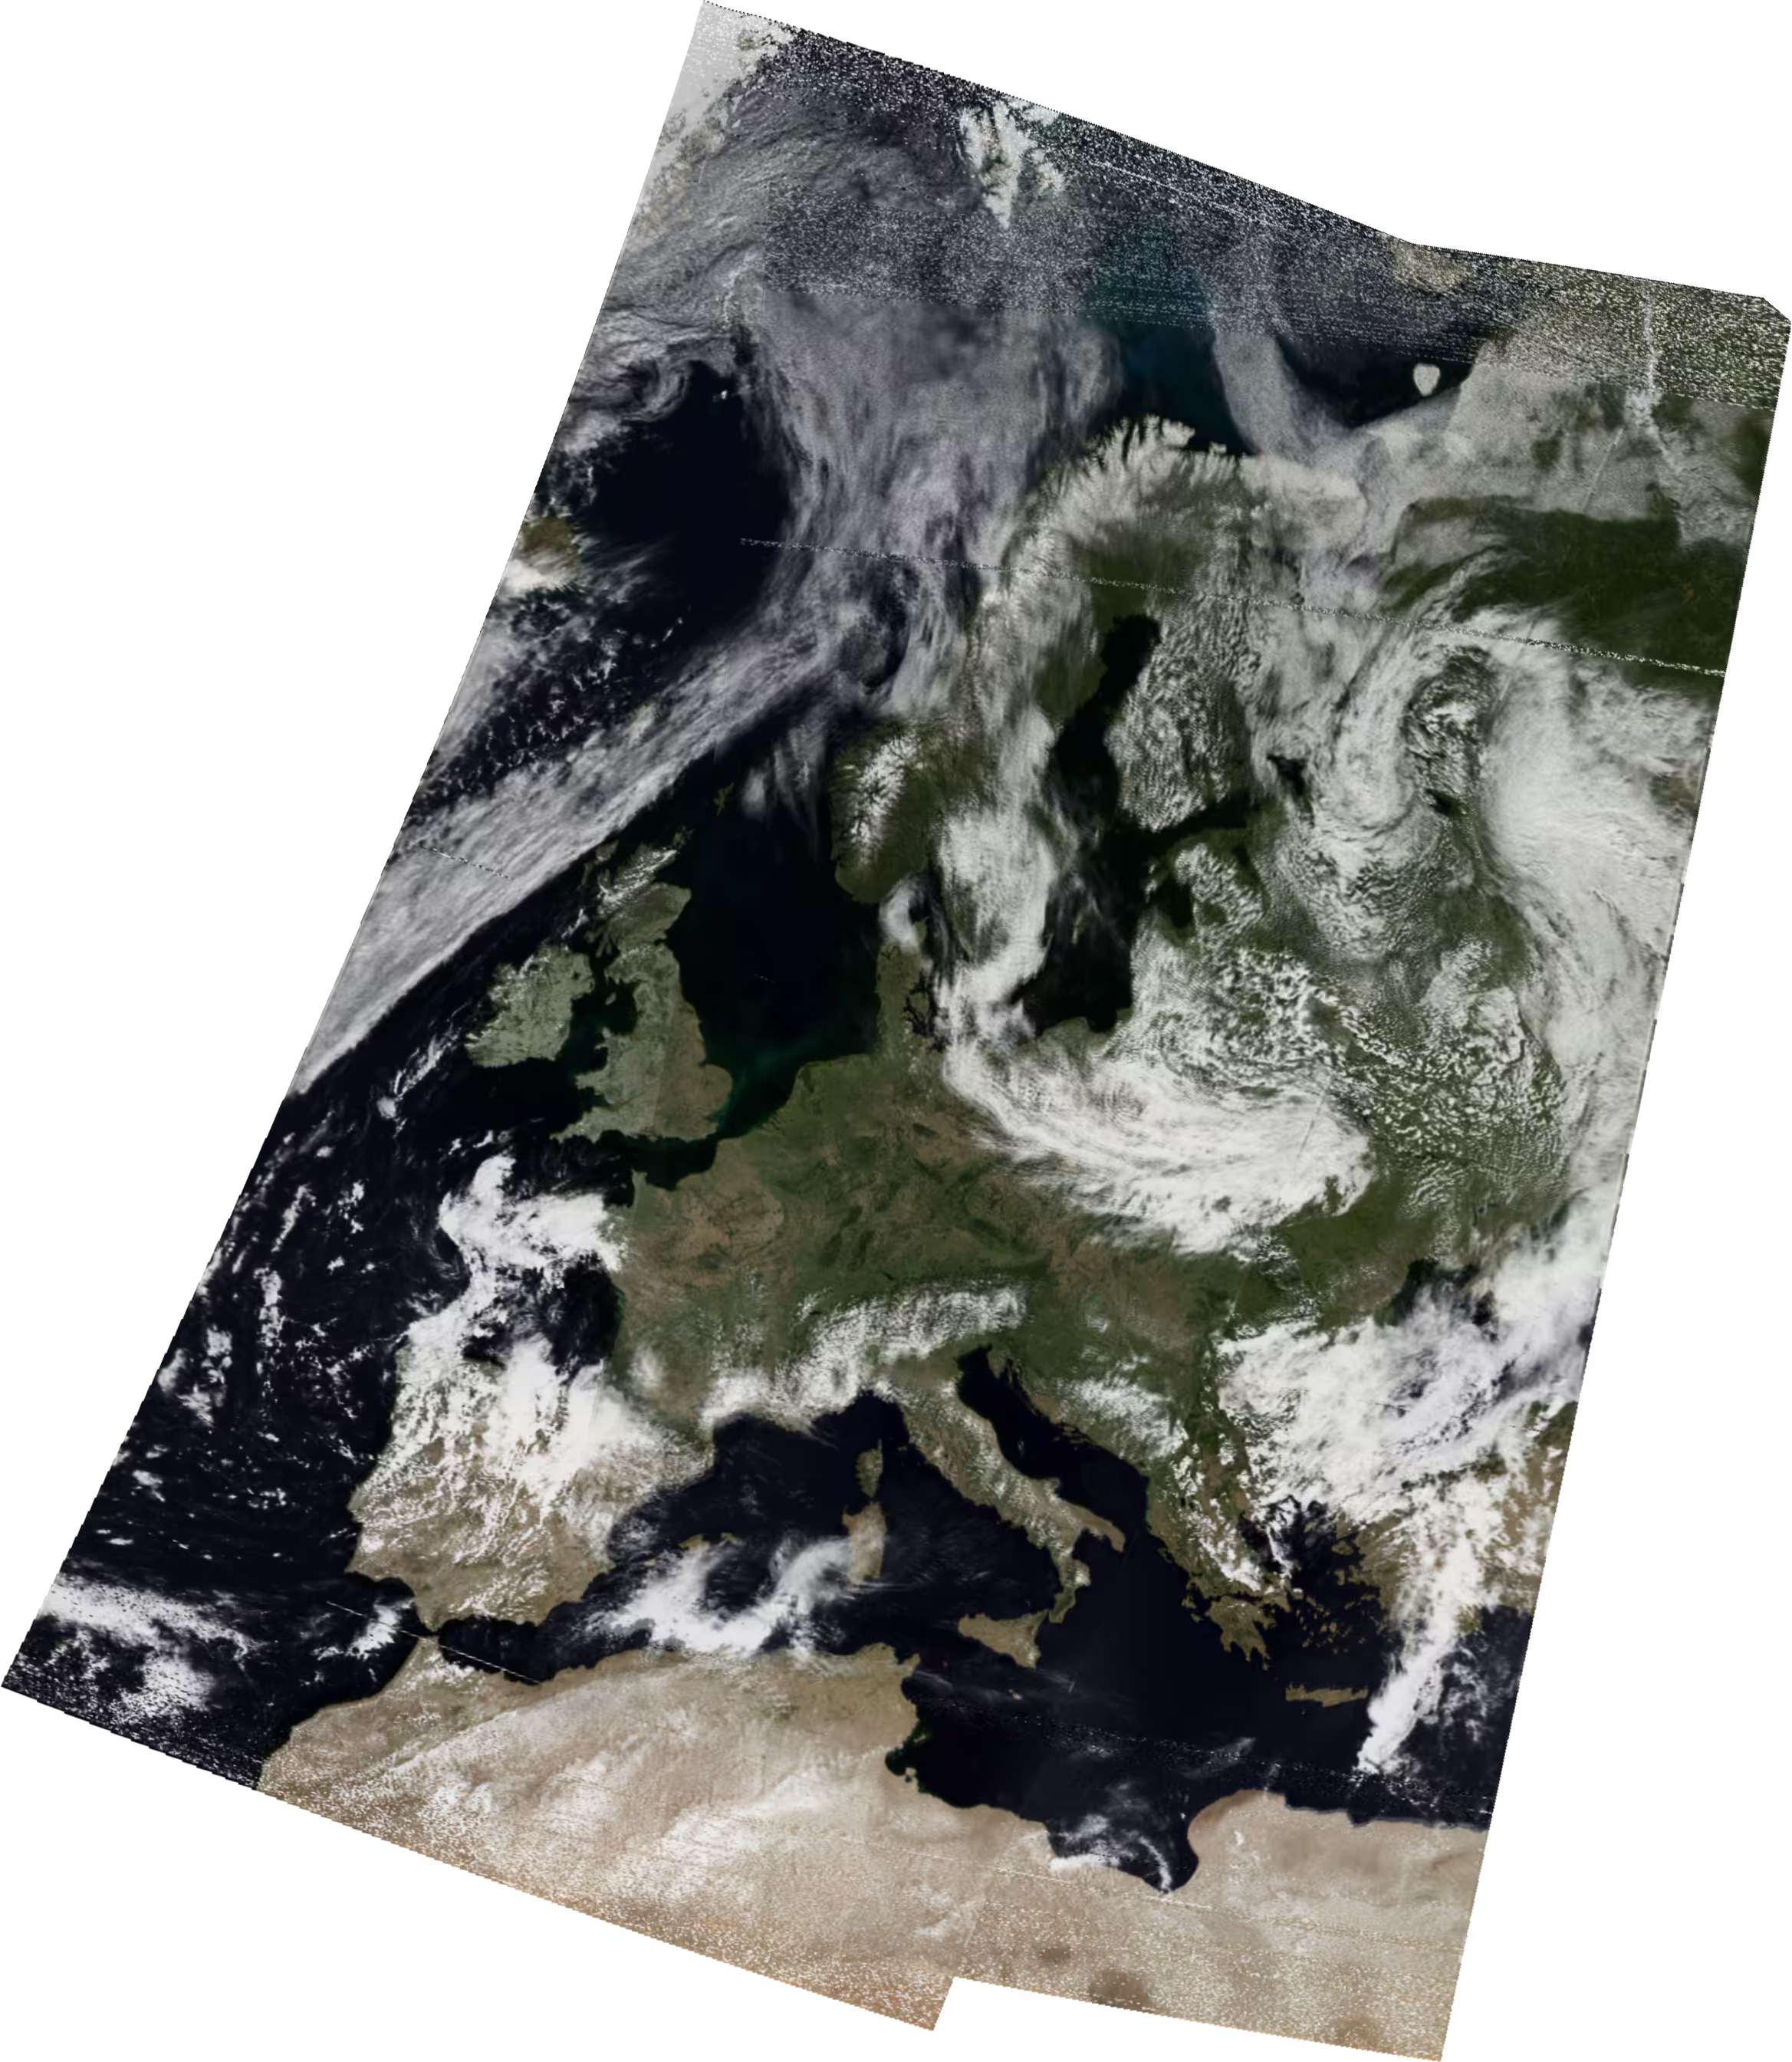
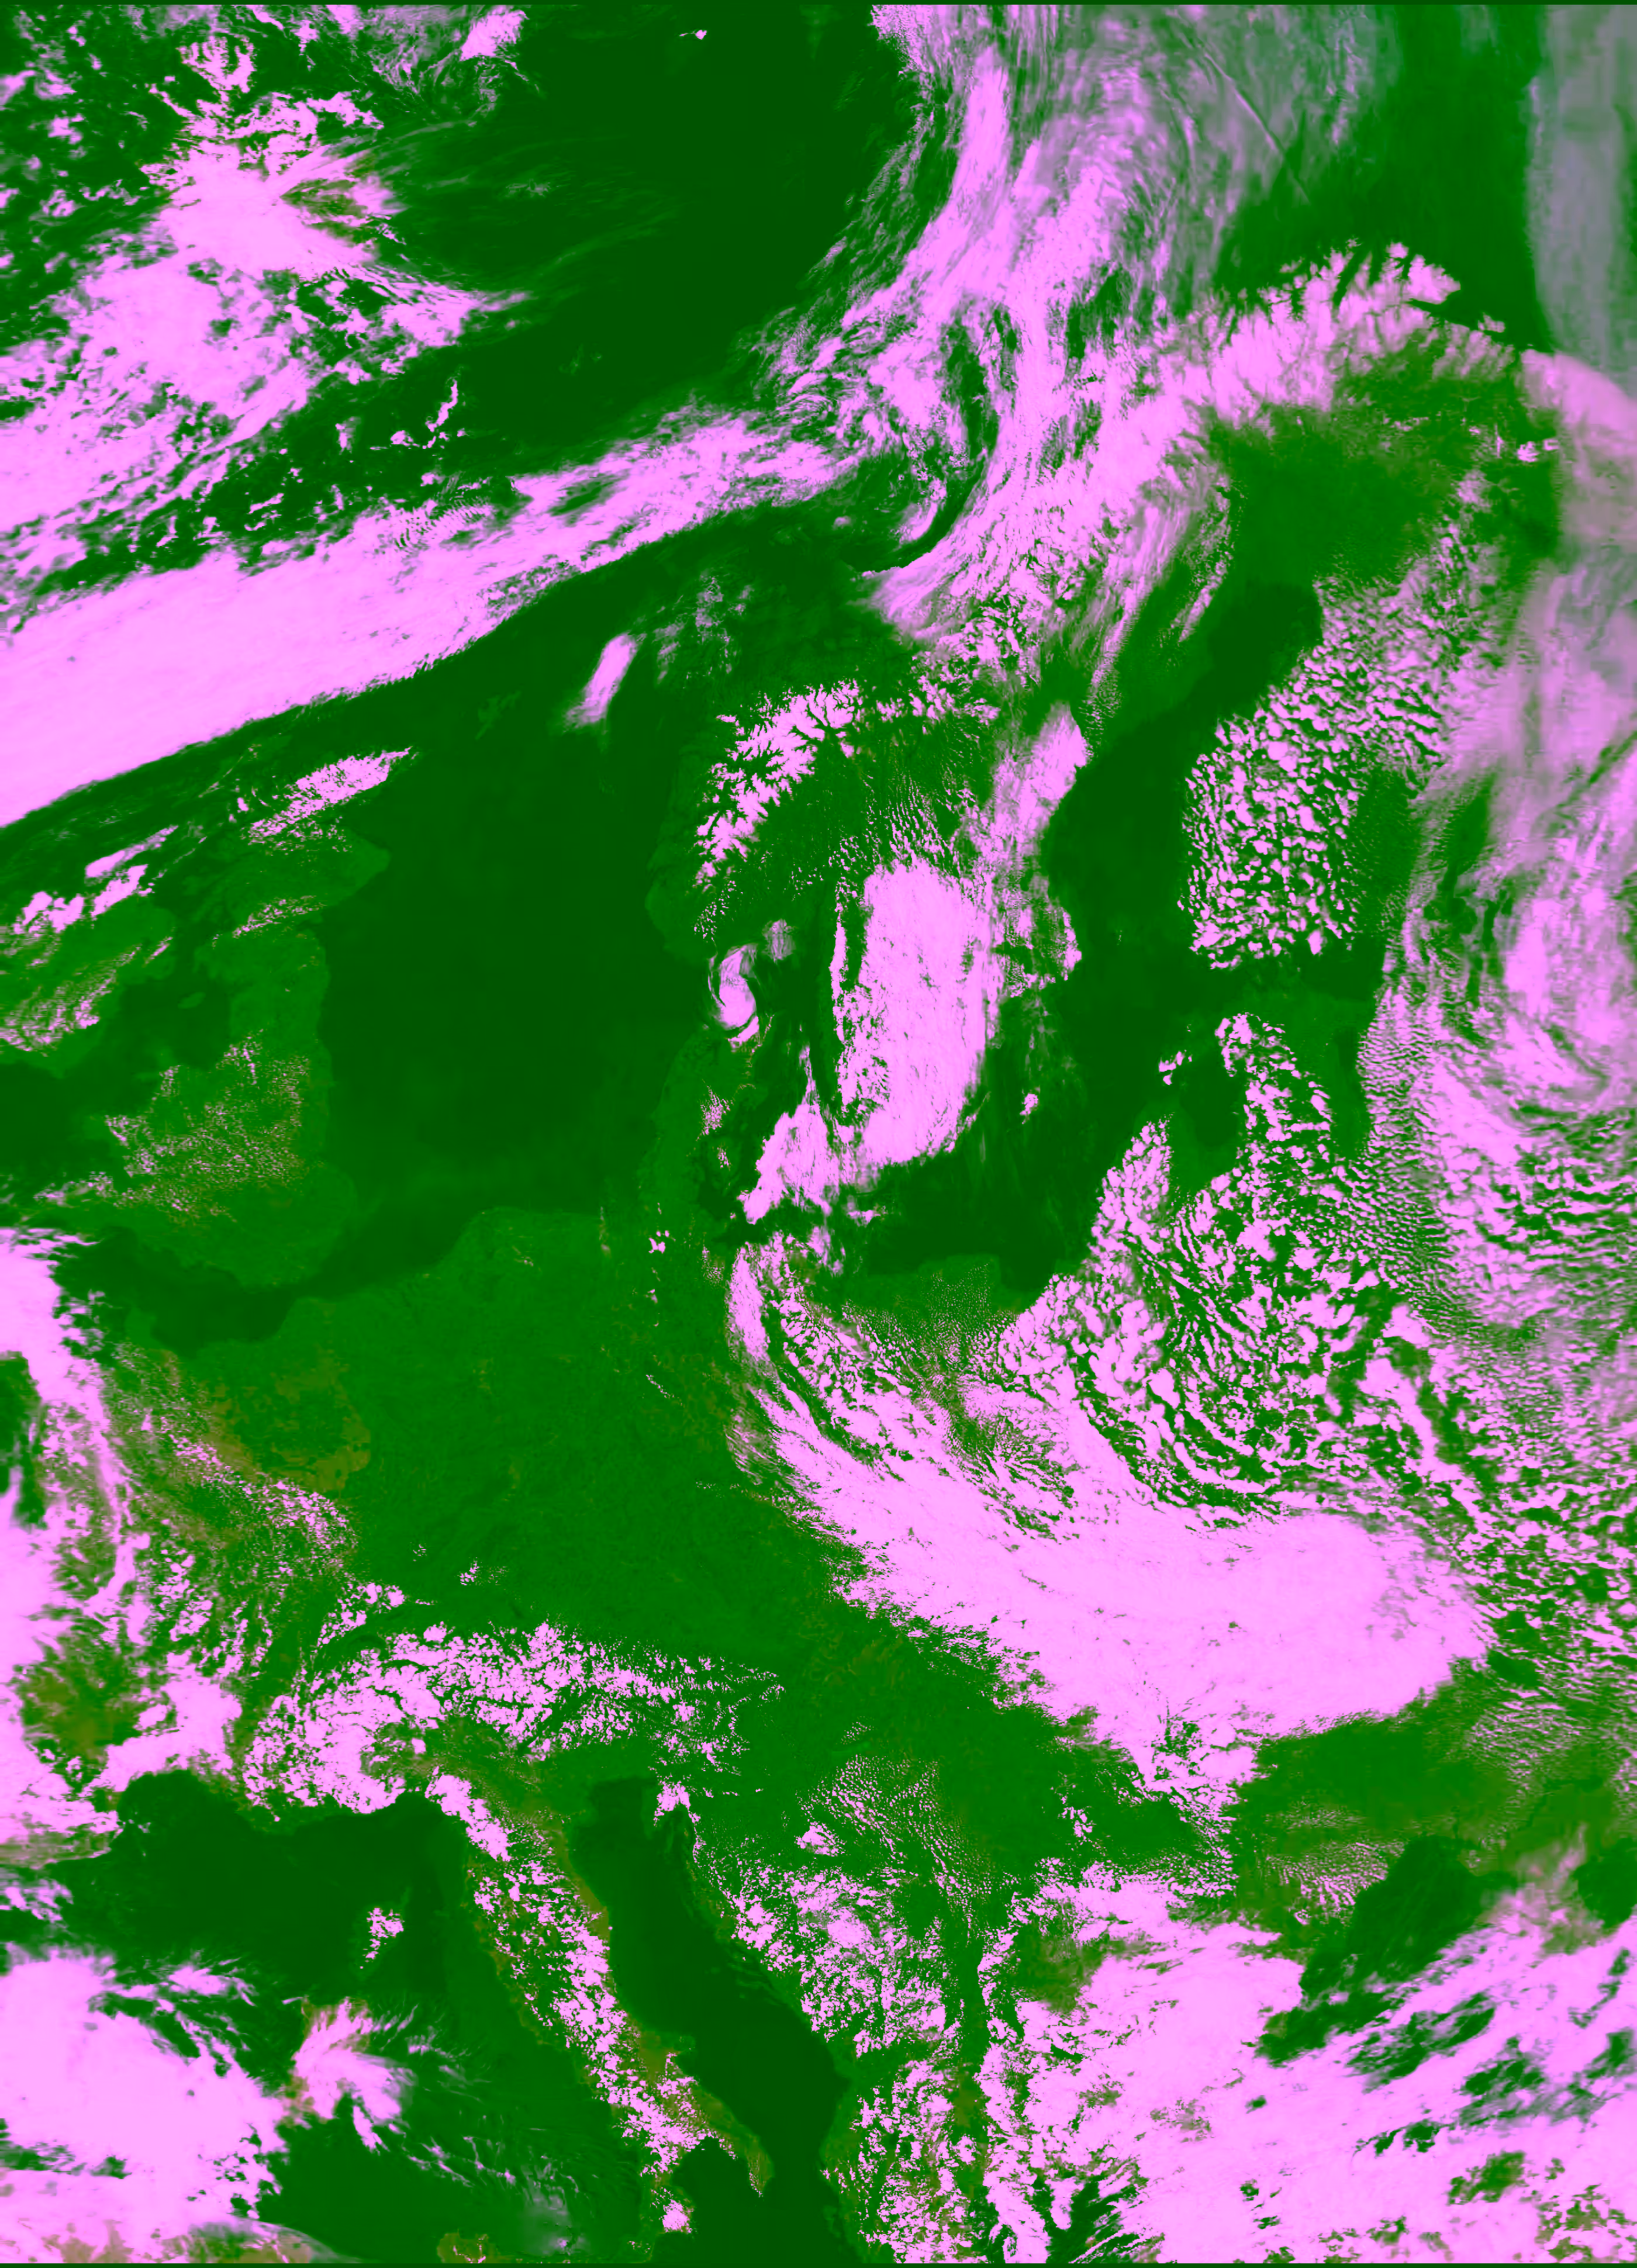
The resulting image (MSA enhancement) is quite nice - with no noise, unlike the images from the NOAA satellites:
End of service for NOAA satellites
Unfortunately in April 2025, NOAA announced the end of service for June 16, 2025 for the three satellites from the POES constellation. In practice however, this should not be as tragic as it sounds. The satellites will not be suddenly turned off, but no efforts will be taken to resolve any issues. So hopefully, they will continue transmitting for many more years.